
Elasticsearch Data Ingestion: All Methods and Use Cases
Elasticsearch Data Ingestion: Every Method from curl to Petabyte Pipelines
Pick the wrong ingestion method and you pay for it continuously — in pipeline complexity, in transformation logic you have to maintain, and in failure modes you discover at 2am rather than during testing. Elasticsearch supports five distinct ingestion paths, and each one is the right answer for a different set of conditions.
This guide covers all five paths — with working code for each — and maps them to the use cases where they belong: search, observability, security, and AI/ML. Two newer additions — EDOT (Elastic Distributions of OpenTelemetry) and Elastic Streams — are covered separately after the core paths.
Key Takeaways
- Elasticsearch supports two data categories: general content (no timestamp) and time-series data — your ingestion method should match (Elastic data ingestion overview).
- The Bulk API caps HTTP requests at 100MB by default and uses NDJSON format; it's the right choice for any batch or high-volume indexing scenario (Bulk API reference).
- Elastic Agent has been GA since v7.14 and is the recommended replacement for standalone Beats — Fleet auto-generates per-agent API keys with minimal permissions (Beats vs Elastic Agent comparison).
- EDOT (Elastic Distributions of OpenTelemetry) provides production-ready OTel distributions with zero-code instrumentation, central config via OpAMP, and EDOT Collector as a drop-in APM Server replacement (EDOT overview).
- Elastic Streams is a Kibana UI for managing data streams centrally — field extraction, retention, routing, and AI-assisted partitioning in one place (Elastic Streams docs).
TL;DR — Five ingestion paths: direct APIs for app events, Bulk API for batch imports, Elastic Agent for logs/metrics/traces, Logstash for Kafka/databases, connectors for SaaS content. EDOT adds production-ready OpenTelemetry distributions. Elastic Streams centralises data stream management in Kibana. Add ingest pipelines for field transformation at any level.
The Elasticsearch Ingestion Decision Tree
Four factors determine which path to take: data type, volume, transformation requirements, and whether Elastic already has an integration for your source. If an integration exists, use it — you're not going to write a better Filebeat module than the people who maintain Filebeat. Pick the simplest option that meets all four; complexity beyond that is a daily maintenance tax.
| Data Type | Volume | Transformation Needed | Recommended Path |
|---|---|---|---|
| Single documents, application data | Low | None | Index API / language clients |
| Batch records, catalog imports | Medium–High | None | Bulk API |
| Any data needing field extraction or enrichment | Any | Yes | Ingest pipelines (+ any input method) |
| Logs, metrics, traces from supported sources | Medium–High | Minimal | Elastic Agent + Fleet |
| OpenTelemetry instrumentation (any language) | Medium–High | Minimal | EDOT SDK + EDOT Collector |
| Kafka, AWS Kinesis, databases | High | Complex | Logstash → Elasticsearch |
| Websites, knowledge bases, SharePoint, Confluence | Any | None–Minimal | Connectors / Web Crawler |
| Text for semantic / vector search | Any | Embedding generation | Ingest pipeline + inference processor |
| Ingestion Method | Throughput | Capacity | Best For | Overhead |
|---|---|---|---|---|
| Bulk API | 9 / 10 | Very High | Batch imports, catalog syncs, migration loads | None — direct API |
| Elastic Agent (Fleet) | 8 / 10 | High | Logs, metrics, traces, security events at scale | Low — agent binary + Fleet |
| Logstash Pipeline | 7 / 10 | High | Kafka, databases, custom protocols | Medium — JVM process, pipeline config |
| Vector Ingest Pipeline | 6 / 10 | Medium | Semantic search, RAG, AI/ML workloads | Medium — per-doc ML inference cost |
| Connectors / Crawler | 4 / 10 | Moderate | SharePoint, Confluence, databases, websites | Low — managed sync, no code |
| Direct Index API | 3 / 10 | Low–Medium | Individual application events, one-off writes | None — direct API |
Throughput scores are an editorial comparison based on Elastic architecture guidance (2026). Vector ingest pipelines score lower due to per-document ML inference cost at ingest time.
Level 1 — Direct Elasticsearch APIs: One Document or Millions
When Elastic Agent or Logstash misbehaves, the Bulk API is where you trace the problem. Every higher-level tool eventually calls it — knowing its error responses, size limits, and partial failure behavior is what lets you tell a client retry bug from a cluster throughput issue.
The Index API — Single Documents
Use POST /{index}/_doc to let Elasticsearch auto-generate a document ID, or PUT /{index}/_doc/{id} to set one explicitly (Index API reference).
# Auto-generated ID
curl -X POST "http://localhost:9200/products/_doc" \
  -H "Content-Type: application/json" \
  -d '{
    "name": "Wireless Keyboard",
    "category": "peripherals",
    "price": 89.99,
    "in_stock": true
  }'
One thing worth knowing: each PUT /{index}/_doc/{id} call targeting an existing document increments the version number and rewrites the document in full — it's not an update. Use POST /{index}/_update/{id} with a partial doc if you only want to touch specific fields. Overwriting unnecessarily burns write amplification budget on the primary and all replicas.
The Bulk API — The Real Workhorse
The Bulk API performs multiple index, create, delete, and update actions in a single HTTP request using NDJSON (Bulk API reference). The default HTTP body size limit is 100MB. In practice, 5MB to 15MB per request is a reasonable starting point — tune from there based on indexing latency and heap pressure.
curl -X POST "http://localhost:9200/_bulk" \
  -H "Content-Type: application/x-ndjson" \
  --data-binary @- <<'NDJSON'
{ "index": { "_index": "products", "_id": "SKU-001" } }
{ "name": "USB-C Hub", "category": "peripherals", "price": 49.99 }
{ "index": { "_index": "products", "_id": "SKU-002" } }
{ "name": "Mechanical Keyboard", "category": "peripherals", "price": 129.99 }
{ "delete": { "_index": "products", "_id": "SKU-OLD" } }
NDJSON
Every official language client ships a bulk helper that handles batching, retries, and backpressure. Don't implement your own.
from elasticsearch import Elasticsearch
from elasticsearch.helpers import bulk

es = Elasticsearch("https://your-cluster:9200", api_key="your-api-key")

# Generator yields doc dicts — bulk() handles batching and retries
success, failed = bulk(es, generate_docs(), chunk_size=500, request_timeout=30)
For a broader look at how Elasticsearch fits into your stack architecture, see Getting Started with Elasticsearch.
Level 2 — Ingest Pipelines: Transform Before You Index
Ingest pipelines run inside Elasticsearch — on ingest nodes — before a document is written to a shard. A pipeline is a sequence of processors that modify the document in place (Ingest pipeline processor reference). Geo lookups, reference index joins, and ML model inference all resolve here — before the document touches a shard — because ingest nodes have access to cluster state. That's what makes ingest pipelines the right layer for enrichment and embedding generation rather than handling it in the application or in Logstash.
Common Processors
PUT _ingest/pipeline/web-log-parser
{
  "description": "Parse nginx access logs, enrich with GeoIP, drop health checks",
  "processors": [
    { "grok": { "field": "message", "patterns": ["%{COMBINEDAPACHELOG}"] } },
    { "geoip": { "field": "clientip", "target_field": "geo" } },
    { "convert": { "field": "response", "type": "integer" } },
    { "drop": { "if": "ctx.request == '/health'" } },
    { "remove": { "field": "message" } }
  ]
}
Key processors worth knowing:
grok— Pattern-based text extraction for nginx, apache, syslog. Uses Logstash-compatible patterns.dissect— Faster than grok for predictable delimiters; no regex backtracking cost.geoip— IP to geo lookup using the Maxmind database bundled in Elasticsearch.enrich— Join against an Elasticsearch index at ingest time for metadata lookups.inference— Run a deployed ML model at ingest time for embedding generation.drop— Discard documents before they hit storage. Use for health checks, debug events, high-cardinality noise.
Testing Pipelines with the Simulate API
Never deploy a pipeline without testing it first. The simulate API runs your pipeline against sample documents without writing anything to an index — catches grok mismatches and processor ordering issues before they touch production data.
POST _ingest/pipeline/web-log-parser/_simulate
{
  "docs": [
    { "_source": { "message": "192.168.1.1 - - [18/Mar/2026:12:00:00 +0000] \"GET /api/data HTTP/1.1\" 200 1024" } },
    { "_source": { "message": "10.0.0.5 - - [18/Mar/2026:12:00:01 +0000] \"GET /health HTTP/1.1\" 200 2" } }
  ]
}
Attaching Pipelines to Data Streams
PUT _index_template/web-logs-template
{
  "index_patterns": ["logs-web-*"],
  "data_stream": {},
  "priority": 500,
  "template": {
    "settings": {
      "index.default_pipeline": "web-log-parser",
      "index.final_pipeline": "add-ingest-timestamp"
    }
  }
}
index.default_pipeline runs first. index.final_pipeline runs last — even if the request specified a different pipeline. Use the final pipeline for audit fields that should always be set regardless of caller. Fleet-managed Elastic Agent integrations ship with default ingest pipelines and expose a *@custom pipeline hook as your extension point.
Level 3 — Beats, Elastic Agent, and EDOT: Time-Series Data at Scale
For logs, metrics, uptime data, and security events — data with a @timestamp — the right path is Elastic Agent or Beats, not direct API calls (Beats vs Elastic Agent comparison). Writing raw time-series data through the Bulk API means you're responsible for index management, rollover, and ILM policy assignment. Elastic Agent and the data stream model handle all of that automatically.
Beats — Lightweight Shippers
Beats are single-purpose agents. Filebeat tails log files. Metricbeat scrapes metrics. Packetbeat inspects network traffic. Auditbeat monitors file integrity. A minimal Filebeat config for nginx logs:
# filebeat.yml
filebeat.inputs:
  - type: filestream
    id: nginx-access
    paths:
      - /var/log/nginx/access.log

output.elasticsearch:
  hosts: ["https://your-cluster:9200"]
  api_key: "${ES_API_KEY}"
  data_stream:
    enable: true
  pipeline: "web-log-parser"
Elastic Agent + Fleet — Recommended for Most Teams
Elastic Agent is a single binary that replaces all the individual Beats. GA since v7.14.0. Install one agent per host, configure via Fleet in Kibana, manage centrally.
Fleet auto-generates per-agent API keys with minimal permissions — a meaningful security improvement over sharing a single credential across all Beats instances.
# Download and install
curl -L -O https://artifacts.elastic.co/downloads/beats/elastic-agent/elastic-agent-9.0.0-linux-x86_64.tar.gz
tar xzvf elastic-agent-9.0.0-linux-x86_64.tar.gz
cd elastic-agent-9.0.0-linux-x86_64

# Enroll with Fleet (token from Kibana > Fleet > Enrollment tokens)
sudo ./elastic-agent install \
  --fleet-server-es=https://your-cluster:9200 \
  --enrollment-token=your-enrollment-token
The Fleet-managed model is particularly useful in autoscaling environments. Agents enrolling on new instances pick up their configuration automatically. Combined with cloud-init or a startup script, this gives you zero-touch agent provisioning consistent with how Kubernetes teams expect infrastructure to work.
EDOT — Elastic Distributions of OpenTelemetry
EDOT is Elastic's production-ready distribution of OpenTelemetry, and it's the recommended path for new OpenTelemetry-based instrumentation. All EDOT SDKs (Java, Python, .NET, Node.js, PHP, Android, iOS) are GA, as is the EDOT Collector (EDOT overview).
What EDOT adds over upstream OpenTelemetry:
- Zero-code instrumentation — preselected instrumentations enabled by default; no code changes needed for most frameworks
- Central configuration via OpAMP — manage all EDOT agents from Kibana Fleet without redeploying
- Inferred spans — EDOT derives spans from profiling data, improving trace coverage without code changes
- EDOT Collector as APM Server replacement — the EDOT Collector ships
elasticsearchexporterfor native Elasticsearch ingestion andelasticapmintakereceiverfor backward-compatible APM intake
A minimal EDOT Collector config routing OTel data to Elasticsearch:
# edot-collector.yml
receivers:
  otlp:
    protocols:
      grpc:
        endpoint: "0.0.0.0:4317"
      http:
        endpoint: "0.0.0.0:4318"

exporters:
  elasticsearch:
    endpoints: ["https://your-cluster:9200"]
    api_key: "${ES_API_KEY}"
    logs_index: "logs-otel-default"
    traces_index: "traces-apm-default"

service:
  pipelines:
    traces:
      receivers: [otlp]
      exporters: [elasticsearch]
    logs:
      receivers: [otlp]
      exporters: [elasticsearch]
If you're already on upstream OTel, EDOT is a drop-in replacement — same wire protocol, same SDKs, with Elastic-specific extras layered on top. The EDOT vs upstream comparison documents exactly what differs.
Level 4 — Logstash: Non-Standard Sources and Heavy Transformation
Logstash is the right tool when Elastic Agent doesn't have an integration for your data source (Logstash as input architecture guide). The primary documented cases are AWS Kinesis, databases via JDBC, and Kafka. Check the Integrations quick reference before reaching for Logstash — if the integration exists, Elastic Agent handles it with less overhead: no JVM to tune, no pipeline worker configuration, centralized management through Fleet.
# logstash.conf
input {
  kafka {
    bootstrap_servers => "kafka-broker:9092"
    topics => ["application-events"]
    group_id => "logstash-consumer"
    codec => "json"
    consumer_threads => 4
  }
}

filter {
  mutate {
    rename => { "ts" => "@timestamp" }
    remove_field => ["kafka"]
  }
}

output {
  elasticsearch {
    hosts => ["https://your-cluster:9200"]
    api_key => "${ES_API_KEY}"
    data_stream => true
    data_stream_type => "logs"
    data_stream_dataset => "kafka.application"
    data_stream_namespace => "production"
    pipeline => "application-event-enricher"
  }
}
Keep Logstash filters lean and push transformation into Elasticsearch ingest pipelines. Ingest pipelines run on Elasticsearch nodes with access to cluster state — geo lookups, reference index enrichment, ML model inference. Logstash filters don't have that. Let Logstash handle transport and protocol; let Elasticsearch do the field-level work.
Level 5 — Connectors and the Web Crawler: Content for Search
When your data lives in SharePoint, Confluence, Jira, MongoDB, or PostgreSQL, use a connector or the Elastic Web Crawler instead of custom ingestion code (Connectors and crawler ingest for search). Connectors sync read-only replicas of external content into Elasticsearch indices, handling incremental syncs, deletion detection, and schema mapping. Configure them in Kibana — no pipeline to maintain, no agent on the source system.
Available connector types include: S3, GCS, Azure Blob, SharePoint Online, Confluence, Jira, Notion, MongoDB, PostgreSQL, MySQL, Oracle, Slack, Salesforce, and a Python connector framework for custom sources.
Connector Sync Modes — Full vs Incremental
Full sync re-indexes all documents from the source on each run. Incremental sync only fetches documents modified since the last successful run. For incremental to work, the source must expose a reliable last_modified timestamp or equivalent. Without it, full sync is your only option — schedule during low-traffic windows. Incremental syncs can run hourly or more frequently without meaningful cluster impact.
Elastic Streams: Centralized Data Stream Management
Elastic Streams is a relatively new Kibana UI that brings field extraction, data retention, routing, and processing configuration into one place — without needing to manage index templates or ingest pipelines directly (Elastic Streams docs). GA on Elastic serverless; GA on Stack since 9.3.
Streams operates in two modes:
Classic streams work with existing Elasticsearch data streams. From the Streams UI you can:
- Extract fields from log messages without reindexing
- Set retention periods (replaces manual ILM configuration)
- Route incoming data to different streams based on field values
- Add processing rules with a visual editor
Wired streams (Preview since 9.2 on Stack) add a parent-child hierarchy. Child streams automatically inherit mappings, lifecycle settings, and processors from their parent. An AI-assisted partitioning feature suggests how to split a stream based on field cardinality — useful when a single high-volume stream needs to be split by environment, region, or service. Changes to the parent propagate to all children automatically.
Access Streams via the Kibana nav or directly from a document detail panel in Discover. It's designed for operations teams who need to manage data routing without writing API calls or touching index templates.
For teams already using data streams heavily, Streams doesn't replace the underlying primitives — it wraps them with a UI and adds AI-assisted tooling. The underlying data stream, ILM policy, and ingest pipeline are still there and still manageable directly.
Elasticsearch for Search and Observability
Search
The core ingestion pattern for search: direct API or connector → index with explicit mappings → query with relevance tuning. Define your mappings before you index — Elasticsearch does dynamic mapping by default, but the inferred types are rarely optimal. A keyword field won't be analysed; a text field runs through the analyser but can't aggregate efficiently. Multi-field solves this:
PUT /product-catalog
{
  "mappings": {
    "properties": {
      "name": {
        "type": "text",
        "fields": { "keyword": { "type": "keyword" } }
      },
      "category": { "type": "keyword" },
      "price": { "type": "float" },
      "created_at": { "type": "date" }
    }
  }
}
Observability: Logs, Metrics, Traces
Observability data is always time-series. Use Elastic Agent with the system, APM, or infrastructure integrations. Data goes into data streams following the logs-{dataset}-{namespace}, metrics-{dataset}-{namespace}, and traces-{dataset}-{namespace} naming scheme — each mapping to pre-built ILM policies and Kibana dashboards.
For custom application tracing, instrument via the APM agent or EDOT SDK (see Level 3). Both route data to the same APM data streams and surface in Kibana Service maps, error rates, and latency histograms without any custom ingest code.
For the broader context on observability strategy and AI-powered monitoring, see AI Observability Trends.
Elasticsearch for Security and AI/ML
Security: SIEM
Elastic Security uses the Elastic Common Schema (ECS) — a standardized field naming convention that makes data from different sources comparable in the same index. Elastic Agent security integrations handle ECS mapping automatically. For custom log sources, use a grok ingest pipeline that maps your fields to ECS names. The fields that matter most: source.ip, destination.ip, process.name, user.name, event.action, event.outcome.
PUT _ingest/pipeline/custom-firewall-to-ecs
{
  "processors": [
    {
      "grok": {
        "field": "message",
        "patterns": ["%{IP:source.ip}:%{INT:source.port} -> %{IP:destination.ip}:%{INT:destination.port} %{WORD:event.action}"]
      }
    },
    { "set": { "field": "event.dataset", "value": "firewall.log" } },
    { "set": { "field": "event.module", "value": "custom-firewall" } }
  ]
}
ECS compliance is what enables Kibana's pre-built detection rules to work against your custom data. Without it, you're writing every correlation rule from scratch.
AI/ML with Vectors: ELSER and Semantic Text
For most semantic search use cases, semantic_text is the recommended field type. It handles embedding generation automatically via an inference endpoint — you configure the endpoint once and Elasticsearch generates embeddings at index time (Vector search overview).
PUT /knowledge-base
{
  "mappings": {
    "properties": {
      "title": { "type": "text" },
      "content": { "type": "text" },
      "content_embedding": {
        "type": "semantic_text",
        "inference_id": "my-elser-endpoint"
      }
    }
  }
}
For more control — or for cases requiring a custom model — use an ingest pipeline with an inference processor (Dense vs sparse vector ingest pipelines):
PUT _ingest/pipeline/elser-embedding-pipeline
{
  "description": "Generate ELSER sparse vector embeddings at ingest time",
  "processors": [
    {
      "inference": {
        "model_id": ".elser_model_2",
        "input_output": [{ "input_field": "content", "output_field": "content_tokens" }]
      }
    }
  ]
}
ELSER (.elser_model_2) generates sparse vectors — token-weight pairs — with no model tuning required. For most teams without an ML engineering function, start with semantic_text or ELSER. Dense models (sentence transformers) offer more control but need domain-specific selection and potentially fine-tuning.
For how this fits into broader AI search patterns, see Agentic AI Workflows.
Elasticsearch Architecture for High-Volume Ingestion
At multi-TB daily ingest volumes, the architecture decisions become as important as the ingestion method itself. The diagram below shows the full pipeline: data sources → ingestion paths → ingest node processing → tiered storage → query interfaces.
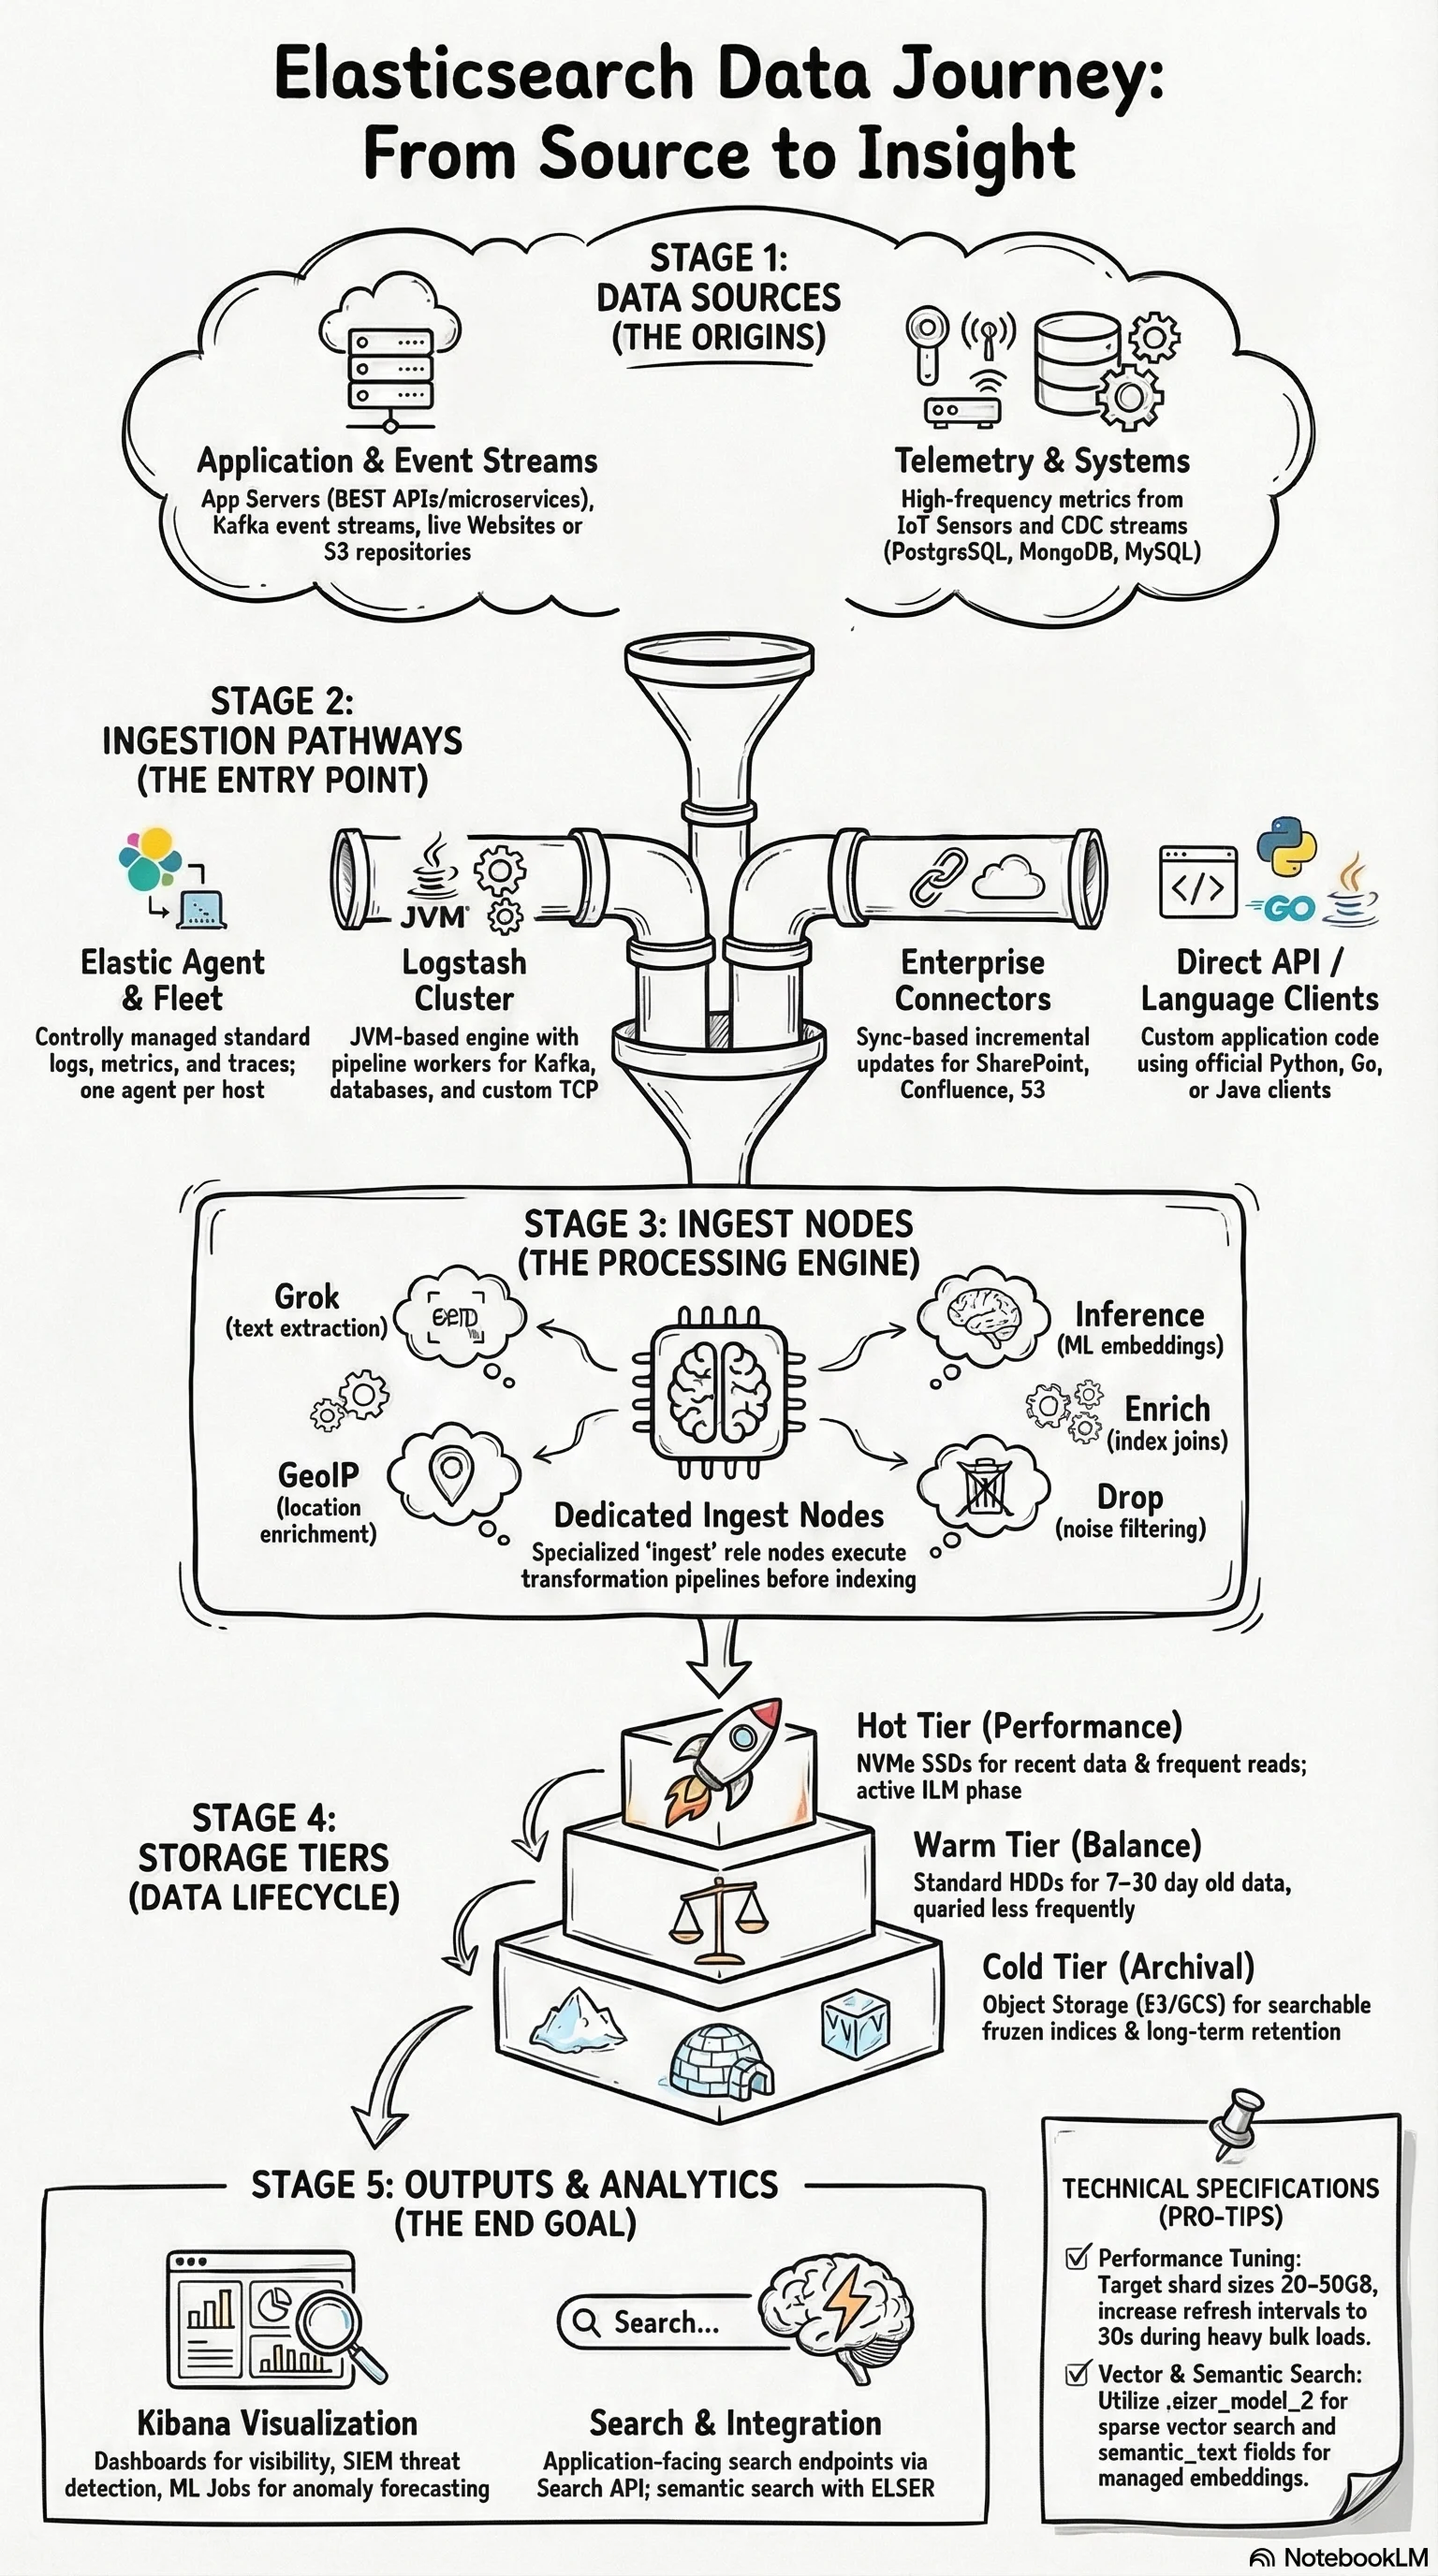
Dedicated ingest nodes. At high throughput, ingest pipeline processing competes with search and indexing on data nodes. Dedicated ingest nodes (role: ingest, no data) isolate that CPU load. Heavy ML inference pipelines are especially worth moving to dedicated nodes.
Data tiers with ILM. Hot tier (SSD) holds recent data. Warm tier (HDD) holds older, less queried data. Cold tier (object storage) holds archival data. ILM automates rollover and tier migration. Data streams map naturally to this model.
Refresh interval tuning. The default refresh interval is 1 second. During high-throughput bulk indexing, setting index.refresh_interval to 30s significantly reduces indexing overhead. Re-enable after the load completes.
Shard sizing. Target 20–50GB per shard. Oversharding is the most common performance mistake — 100 shards for a 500GB index means 100 coordination points responding to every search. 15–25 shards is more appropriate at that size.
The ingest pipeline layer is often where cost optimisation lives at scale. Dropping events at ingest — filtering health checks, debug logs, and internal noise with a drop processor — can reduce index volume by 20–40% on typical application log workloads. Profile what you're actually ingesting before deciding how many nodes you need.
For the architectural principles around distributed systems failure isolation that apply here, see Distributed Computing Fundamentals.
Elasticsearch Ingestion: Frequently Asked Questions
What's the difference between the Index API and the Bulk API?
The Index API writes one document per HTTP request. The Bulk API writes many operations in a single request using NDJSON format, with a 100MB default size limit (Bulk API reference). Use the Index API for individual application events. Use Bulk for any batch or high-volume scenario — significantly more efficient in terms of network overhead and indexing throughput.
When should I use Logstash instead of Elastic Agent?
Logstash is the right choice when Elastic Agent doesn't have an integration for your data source — primarily AWS Kinesis, databases, and Kafka (Logstash as input architecture guide). Check the Integrations quick reference first. If an integration exists, use Elastic Agent. Logstash adds JVM process overhead that isn't justified when an agent integration can do the same job.
What is EDOT and when should I use it instead of Elastic Agent?
EDOT (Elastic Distributions of OpenTelemetry) is Elastic's production-ready OTel distribution — GA SDKs for Java, Python, .NET, Node.js, PHP, Android, and iOS, plus the EDOT Collector (EDOT overview). Use EDOT when you're building new observability instrumentation and want OTel standards: it gives you zero-code instrumentation, OpAMP-based central config from Kibana Fleet, and EDOT Collector as a drop-in APM Server replacement. Elastic Agent is still the right choice for host-level logs and metrics from existing integrations. Both can coexist.
What is Elastic Streams and how does it relate to data streams?
Elastic Streams is a Kibana UI for managing data streams — field extraction, retention settings, routing, and processing rules in one place without direct API calls (Elastic Streams docs). It doesn't replace data streams; it wraps them with a management interface. Classic streams (GA) work with existing data streams. Wired streams (Preview) add parent-child inheritance for mappings and lifecycle settings. It's most useful for operations teams managing many streams who want a visual alternative to index templates.
What's the difference between ELSER and dense vector embeddings?
ELSER (.elser_model_2) generates sparse vectors — token-weight pairs from a ~30,000 term vocabulary — with no model tuning required. Dense vector models (e.g., sentence transformers) generate fixed-dimension float arrays (384 or 1536 dims typically) and may need fine-tuning for your domain. For most teams without an ML function, start with ELSER or the semantic_text field type (Dense vs sparse vector ingest pipelines).
Should I use data streams or regular indices?
Data streams for any time-series data (logs, metrics, traces). Regular indices for general content without a timestamp — product catalogs, knowledge bases, user profiles. Data streams enforce the @timestamp field, manage backing indices automatically, and integrate with ILM for tier-based storage management.
For the foundational concepts behind Elasticsearch cluster design and sharding, see Architecturing to Scale: Cloud Architecture in 2026. For an overview of where Elasticsearch fits in your AI/ML stack, see Search and AI.
About the author: Ade A. is an Enterprise Solutions Architect, focused on AI-powered search, large-scale observability, and security architectures. More posts by Ade A.